Thursday, 18 August 2011

Week 7b (Database)

For assignment 9, we need to use OpenOfficebase to create a database for student management information. It invovles 4 base objects: Tables, Forms, Queries and Reports. Frankly, this is my first time of using of this OpenOfficebase and it is not surprising that i find out it's really confusing and complicated in using this application. Luckily my lecturer and my dearest friends are there to help me and i've learned a lot from them. This task is also time consuming as you have to create different table and a different form. As this is my first time using this database, i don't really know how to edit the data if i mistakenly adding unnecessary data to it. Let say, for example i've created a column of student's date of birth and without realising it, i've created another same column. To my frustration, i couldn't find ways on how to delete that column because of certain problems. In the end, i have to create a whole new table, again. It is such troublesome. Nevertheless, if i am going to be given ample time using this openofficebase, i believe that i can do it better. I believe that this application will make my work easier and efficient in creating database for my student information once i become a real teacher. Basically, this is how the OpenOfficebase looks like:
click to enlarge
Table
click to enlarge


Form

click to enlarge

Query

Report

click to enlarge

I think in order for me to completely understand this kind of thing is by doing a lot practice, again and again! Doing it only one time won't really help me to completely master this application because it brings so much confusion for a first time user like me. However, i believe that this application will help making my future work easier (hope so). I think that's all for this week assignment. Hope to meet again for our next assignment. Have a nice day! =)

Week 7a (Spreadsheet)

This week assignment required us to do a simple one year personal financial management spreadsheet using Calc from the Open Office software. If i were to do it solely based on the instruction provided in our task question, i can say that it's really complicated for me. Furthermore, as i've said many times before, i am quite new with this open office software thus making me quite not confidence in using it. Surprisingly, it's not that hard from what i've thought! To be honest, i think that using Calc is much more easier from using Excel! Here are some of new things that i've learnt from this week assignment. First thing that you have to do is to fill in all of your details for your monthly spending. This includes to rename your sheet with each month. As soon as you have fill in with all of the details required, it is time for you to insert the formula for each of the total needed. 

click picture to enlarge

You need to identify the coordinate of the row and column as it'll be used when you want to create the formula. Below are the example of how you can create the formula:

click to enlarge

As the task need us to create a formula of calculating the balance of previous month and to link the formula between each sheet, we come up with a formula: Selecting the "Balance of the previous month", goes to the previous month balance, and simply "enter" the column. It will then automatically appear in the next month balance that we had selected earlier. Just to make it clear, here's a picture of it =)
Step 1
Step 2
The rest, you just have to copy all the data from the previous month and paste it at the sheet of the new month. You just have to edit the amount of money you've spend in each of your expenditure session. Simple, isn't it? =)

Excel

Using excel this time with all of the formulas needed is quite confusing. And this is totally not my favourite assignment so far. However, shall we have a look on what i've learn for using excel in creating the spreadsheet for students grade and score?

VLOOKUP: used to fill the grade of the students automatically. You can fill the data based on the respective colours that i've given. Click on the fx button and look for a function of VLOOKUP.
click picture to enlarge
STDEV: standard deviation. Again, click on the fx button and search for a function of STDEV. Highlight and drag the whole column to be inserted in the box number1. It will automatically calculate the STDEV.

click picture to enlarge
AVERAGE: The average score for each students. Use the same steps as STDEV. However, instead of choosing the function of STDEV, select the function of AVERAGE.

COUNTIF: used to calculate the number of students for each of the grade. Choose the function of COUNTIF. Highlight and drag the "score" column to be inserted to the range of data. Select the grade that you want to count in the criteria box. ex; "A".
click piture to enlarge
GRAPH: choose data that you want to convert to a graph.
Click picture to enlarge
That's all for this week task. To conclude, I think that knowing all this basic stuff using excel is very useful to me as i know that i'll be using it in future for me to key in and analyze my students performance. Although it is quite confusing and not to mention several mistakes that i've done while i'm completing this task, once i've got used to it, it will be as easy as ABC. I think that's all for now. We'll meet again in my next entry. Have a nice day!


Wednesday, 10 August 2011

Week 6 (Creative effective multimedia production)

Hello!We meet again..=) New week, new assignments..ok, let us start without wasting any time, shall we?

Assignment 7a
Assignment 7a required us to create a presentation kit, based on our mini journal that we had done earlier in week 4. However, as easy as it might sound, the presentation kit should be done using the Open Office Software. Throughout my year of study, i've never use open office software in any of my assignments. Luckily our respective course coordinator, Dr Fatimah had included some reference links for our future consultation. Firstly, i had to learn how to create a master slide. A slide master is the top slide in the hierarchy of slides that stores information about the theme and slide layouts of a presentation, including the background, colour, fonts, effects, placeholder sizes and positioning (office.microsift.com). The reason of creating the slide master is so that we don't have to type for the same information in a new slides. Sounds pretty handy for me. Guess what, this is my first time of knowing the real usage of slide master. Forgive for my ignorance..=) Anyhow, after i have explore all the settings in the open office, i found out that it is not that different from the usual and common microsoft power point. Really, it's not that much different. Doing it was a success. You can check my yahoo group to see my impress presentation kit.

Assignment 7b
Assignment 7b on the other hand required us to develop a multimedia courseware, by using power point. However, despite of producing a normal plain power point, we were told to include all the multimedia elements such as video, a layered graphic and an audio. Video were edited using Window Movie Maker which i can say, quite familiar to me. The new software that i've used for this power point is the Audacity software, which is used in editing audio purpose. It's not that complicated for a newbie in editing like me. Furthermore, Dr Fatimah had included the instruction for us to use the Audacity which i can say very kind of her..=D Nevertheless, once again i had succesfully completed the assignment for this week. Wait till i publish the courseware to see the ultimate power point presentation ever! Sorry, for the hyperbole though..=D I think that's all for today, we'll meet again for the next assignment, have a nice day!

Saturday, 6 August 2011

Week 5 (Multimedia in Education)

Finally, we meet again! Task for week 5 required us to produce a brochure using microsoft publisher and a bookfold using microsoft word. Creating a brochure using microsoft publisher didn't cause a problem for me as i've used to do it during my schooldays, as a school bulletin's member. =)

However, there's new things that i've learned from this week's assignment. If before this i just know how to design a simple brochure using the ready-made template and design from the microsoft publisher, now i know how to design and edit shapes/objects using all the editing software provided from the link by Dr. Fatimah. Who knows that you can design and create objects beautifully just by using the simple microsoft paint! Me myself found that the tips and tutorial provided in creating an object or in my case, drawing an animal is really useful! If you've seen my horrible drawing using Microsoft Paint before this, you would've understand what i'm trying to say. =P

On the other hand, I've never heard of the Photoshop look alike with layers: GMP software thus it took me quite some time for me to fully understand how to use it. All those layers stuff are quite confusing for me. Same goes with the open office vector based drawing. These two software are quite new to me as i've only know the existence of these softwares thru this Computer in Education Course. Nevertheless, i'm trying my best to mastered it.  Collaborative drawing using Google doc is indeed fun and interesting! You can collaborate with others in producing image. In my case, me and my partner (Salma) had tried to use it and we've managed to draw a logo for our organization. I'm looking forward to use this google draw application for my future assignment (if there's any).hehe...

If i would be given choices in doing this 2D graphic editing, i would say that i rather choose Microsoft Paint, Microsoft PowerPoint, Microsoft Word and not to forget, Google draw as i'm already familiar with them and they're easy and simple to use. I think that's all for this week. I've already uploaded our brochure and bookfold in my yahoo groups so feel free to see it and evaluate it yourself as i'm pretty sure it going to give you a good impression of how nice it is. Enough with the self appraising statement. Have a nice day!

Week 4 (SPSS and Qualitative Analysis)

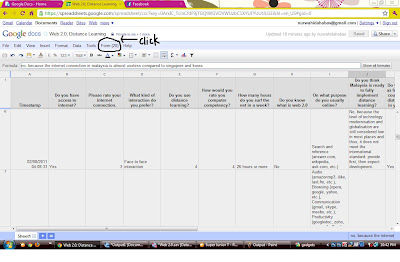
New task for this week! This week, we were given a task based on the online questionnaire that we did earlier. First of all, you have to install the SPSS software so that you can proceed to carry out your task, of course =) Next, you must have all the data  which basically means the feedback of your online questionnaire because we're going to analyze it in the SPSS. To collect your feedback of your questionnaire, simply sign in in your google doc and click on your questionnaire document where you'll be redirected to the new page where all of the responses are recorded.


You can also see the summary of your survey by simply click on the 'Form', and 'Show summary of responses'.

this is how it'll look like..

Done with the google doc questionnaire. Next, we'll proceed to the SPSS to do our data analysis. Right after you open your SPSS Statistic, you can start to fill in your data at the required variables.


Click on the 'Type' box to choose your types of data. Choose 'String' for scale-type of  data or 'Numeric' for objective-type of data..


Key in your data values according to your types of variable..

When you've finished filling in all your variables, you can start to key in your results of your survey at the section of 'Data View'.

Key in your results according to the variables that you've set earlier.

When you're done with all the results, proceed to analyze your data in a form of frequency table to make it easier for you to read your data and to do your next mini journal.


and this is how your frequencies table'll look like.

I can finally understand ways of how to use this SPSS Statistic software. With the guidance from my respective lecturer, using SPSS is actually easier from what i've thought before. SPSS also helps me to analyze and summarize my data collection in a simpler form so that I can finally done my research and mini journal easily. Doing the mini journal next is not really a problem to me and my partner as we've used to write academic writing throughout our assignments all this time. We just have to use all the datas provided from the SPSS in order for us to support our point of view. Overall, this week task mainly introduce us about the usage of SPSS Statistic so that we can familiarize ourself with the usage of it for our future assignments.

That's all for now i guess. Have a nice day! =)